How can we help?
General information on dashboards
The “Reports” menu lets you create visual representations (graphs or tables) using the data from the actions, and share them with other users.
Rights
Pilot” or “Executive” rights are required to edit a dashboard, but “Collaborator” rights are sufficient for read-only access.
Data
All action data can be displayed in the form of a visual representation:
- Number of actions
- The people in charge of actions
- Custom fields for actions and their values
- The status of actions
- The date of completion
Type of dashboard
There are 4 types of dashboard:
Analytical dashboard: Allows actions to be broken down by custom field, useful for a detailed analysis of the status of actions. Valid only if you have previously configured folder templates with custom fields (see the “Groups” chapter).
Graphical dashboard: Displays stock data in graphical form for quick, intuitive viewing.
The advanced graphical dashboard: Identical to the graphical dashboard, but with the option of having different data sources for each graph.
The “OKR” dashboard: used to aggregate actions to measure the overall progress of an action spread across several files.
General principles
- The graphs and tables in the ‘Reports’ menu are updated dynamically as soon as an action is modified in a folder.
- Click on a data item in a graph or table to access the details of the actions concerned.
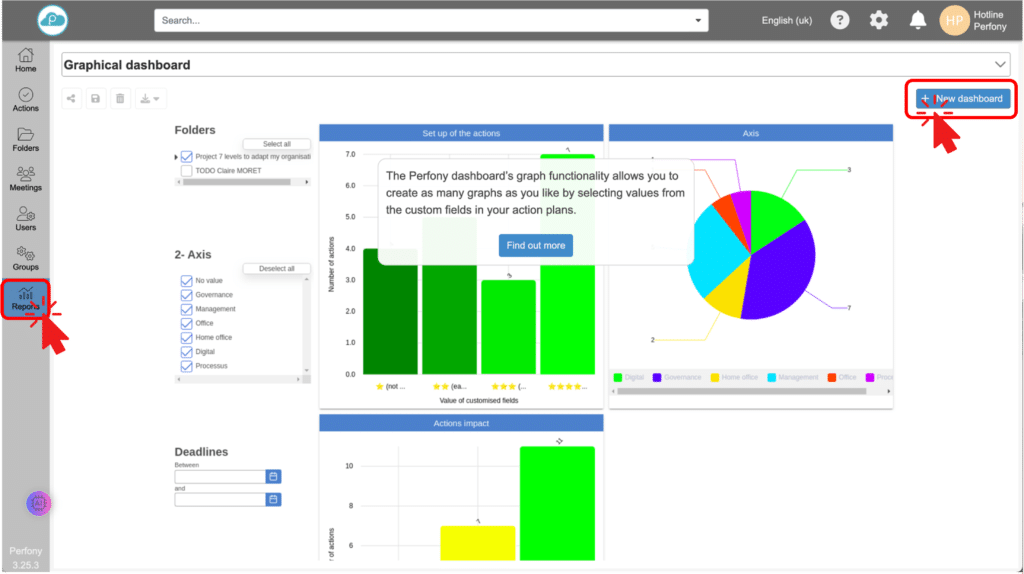
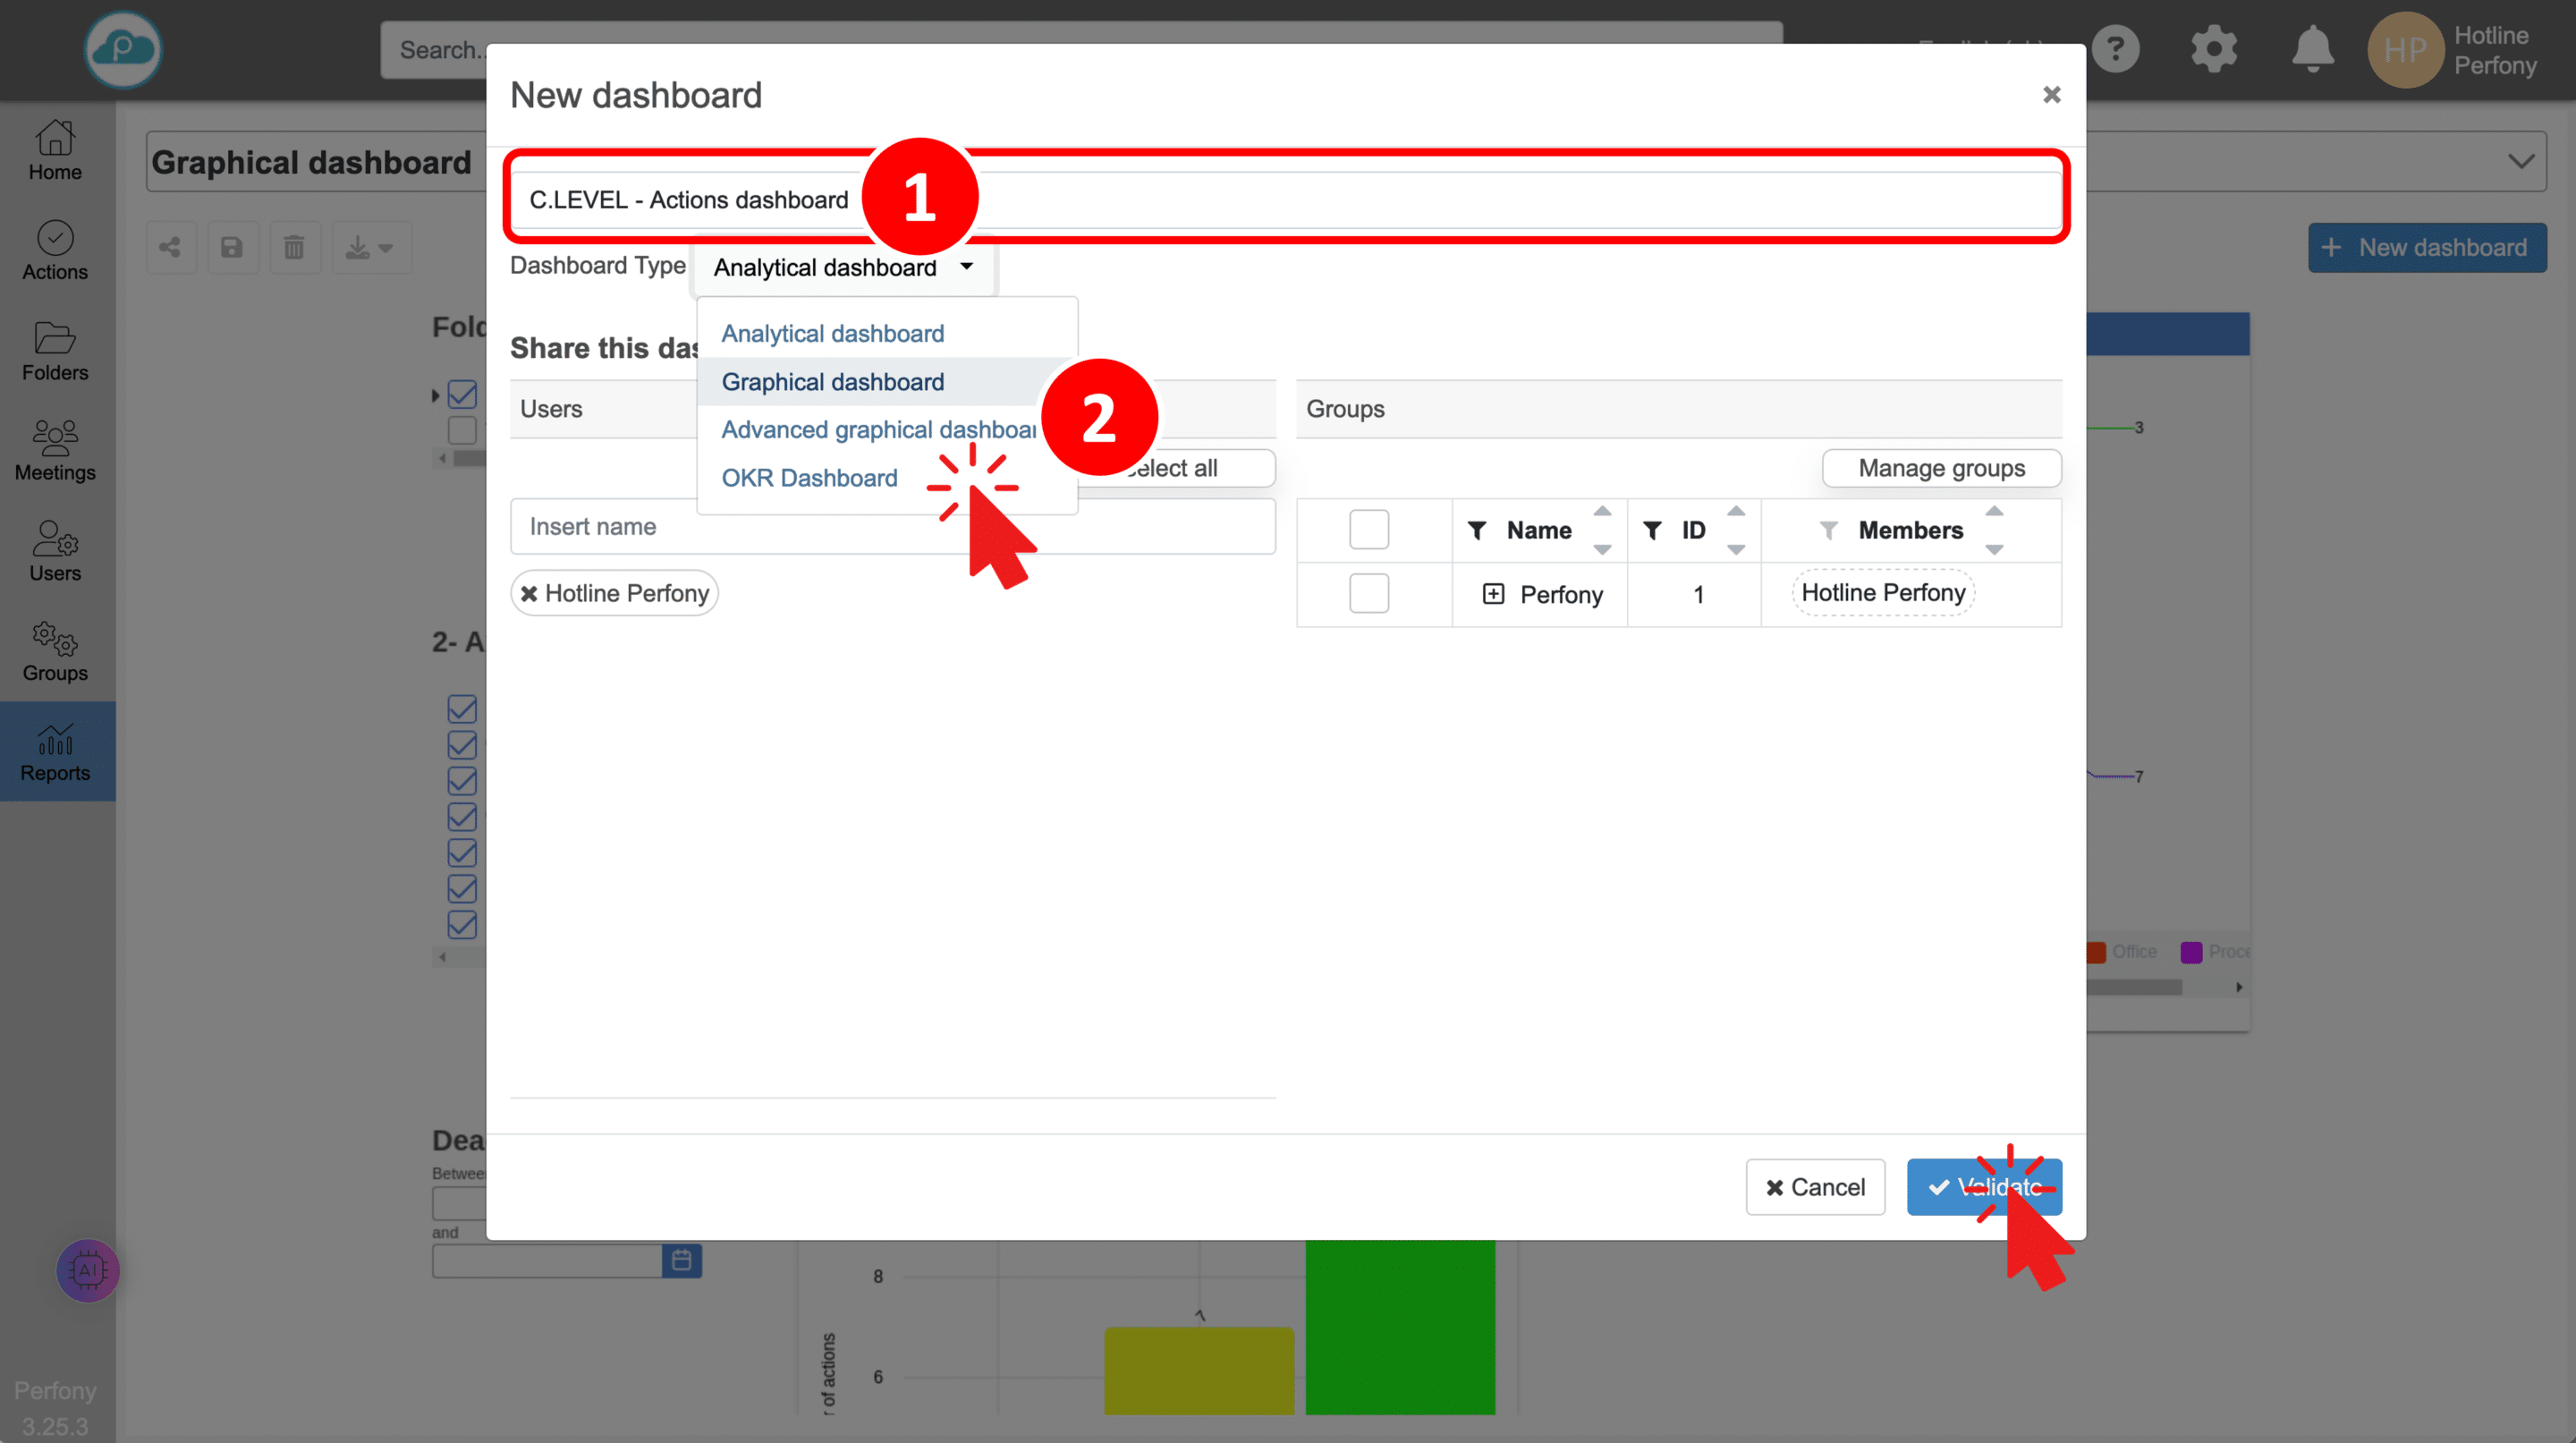
- To create a Dashboard, simply :
- Go to the “Reports” menu
- Click on “New dashboard
- Enter a name for your dashboard
- Choose a model
- Validate creation

