How can we help?
Advanced graphical dashboard
The main advantage of the advanced graphical dashboard is that you can display graphs with different source folders on the same dashboard.
Rights and Access:
“Pilot” rights are required to create and edit an analytical dashboard.
Other users can see it in their “Report” menu once it has been shared with them.
Creation:
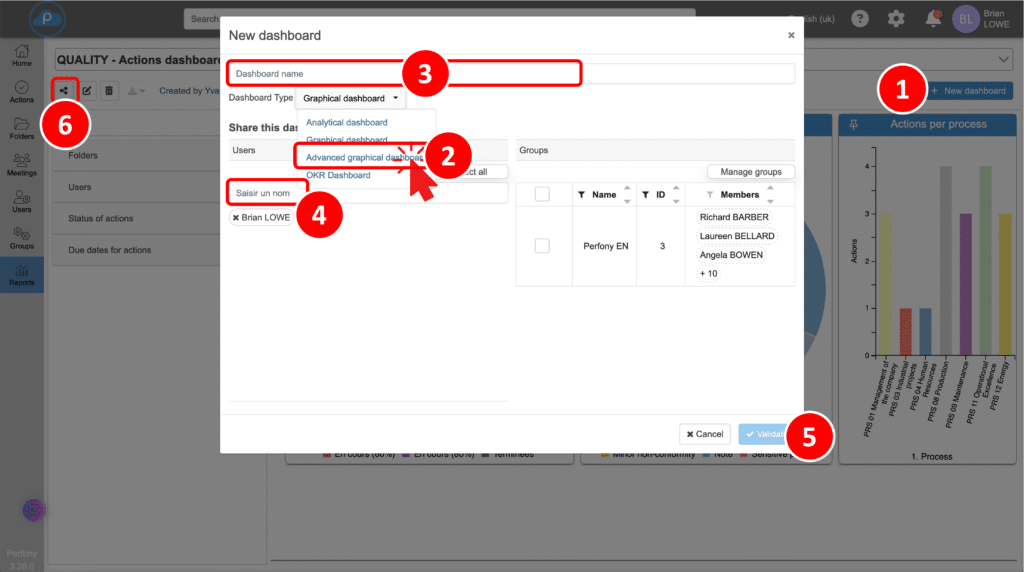
Click on “New Dashboard”
Select the “Advanced Graphic Dashboard” type
Give your dashboard a name, which will appear in the drop-down menu
Specify the users with whom you wish to share your read-only dashboard
Validate your creation
Editing and Modifying the Dashboard
Once your dashboard has been validated, you can start filling it in. The next time you log in, access your dashboard from the “Reports” menu and the drop-down menu.
Here’s what you can do:
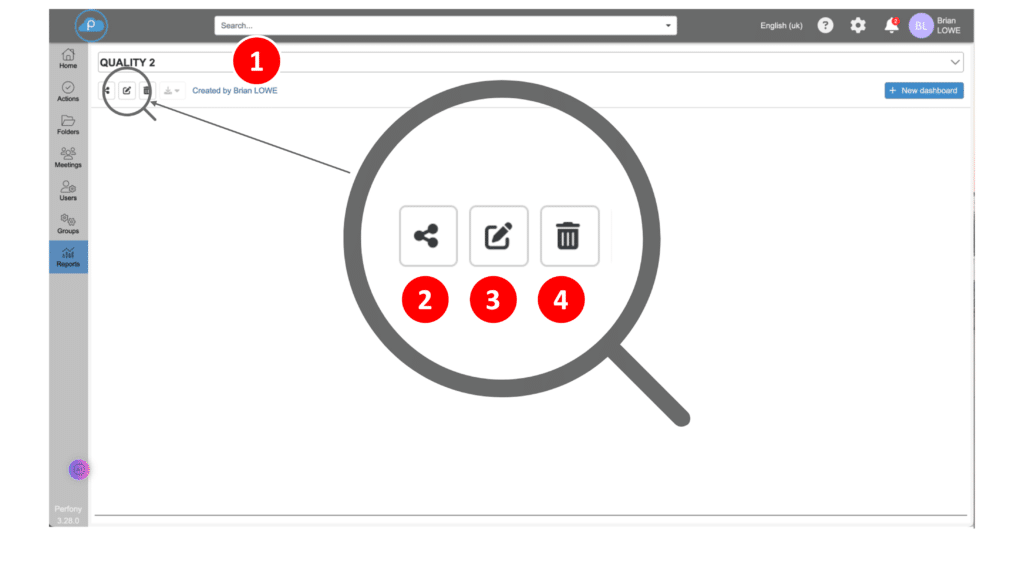
- Change name: You can change the name of the dashboard at any time.
- Choose the users you wish to share it with
- Editing and saving changes: To make content or configuration changes, click on “Edit”. Remember to save your changes by clicking on the icon again. Make sure you switch back to reading mode before leaving the page.
- Deleting the Dashboard: Please note that any deletion is permanent. Before deleting your dashboard, please consider the following points
Graphics configuration
Now that you’ve created your dashboard, you can add graphs to it. Unlike the graphical dashboard, here there are no filters displayed on the dashboard, as they are integrated into each graph.
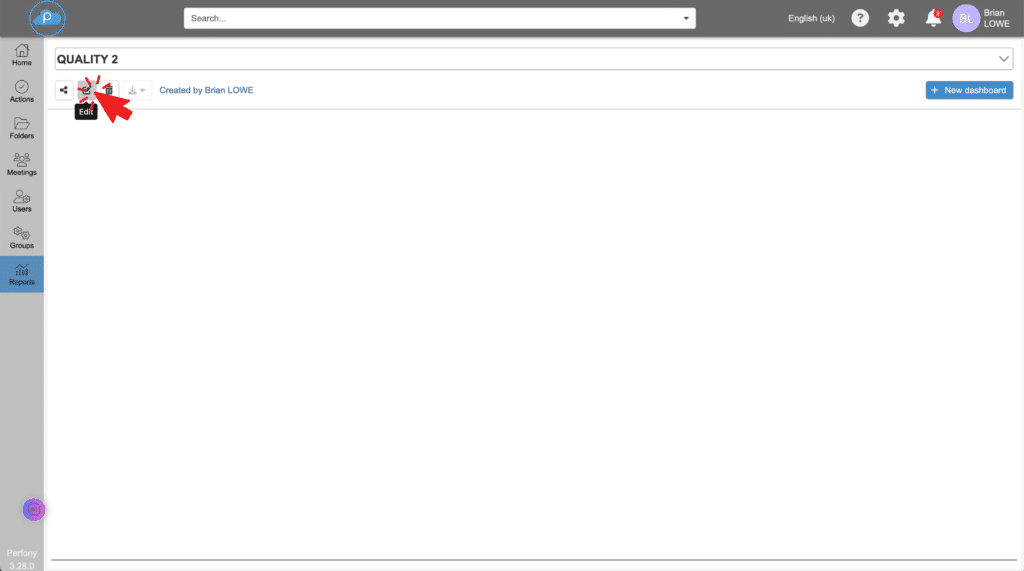
Step 1: Switch to edit mode by clicking on the edit icon
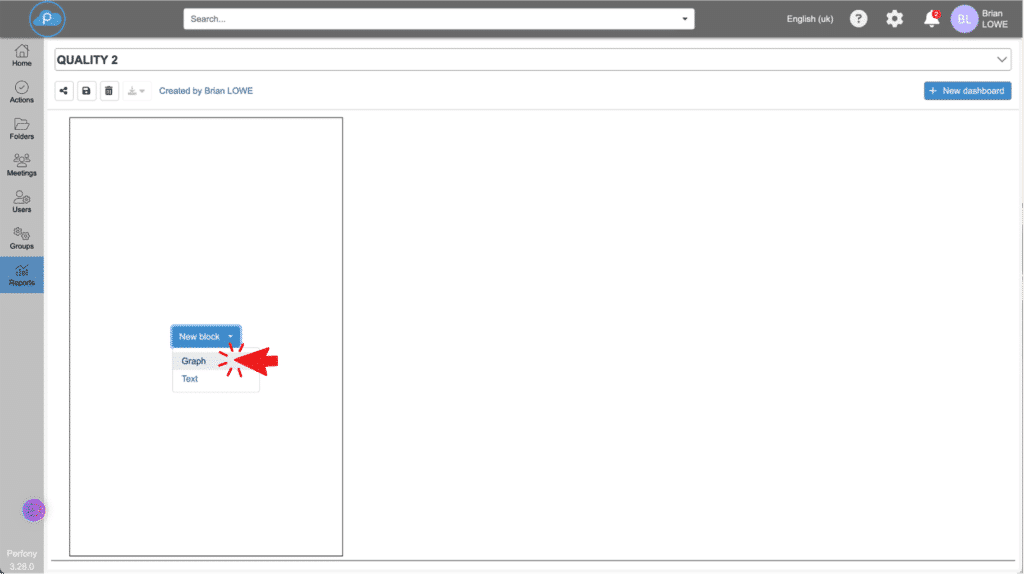
Step 2: Select “graphic” in the design block
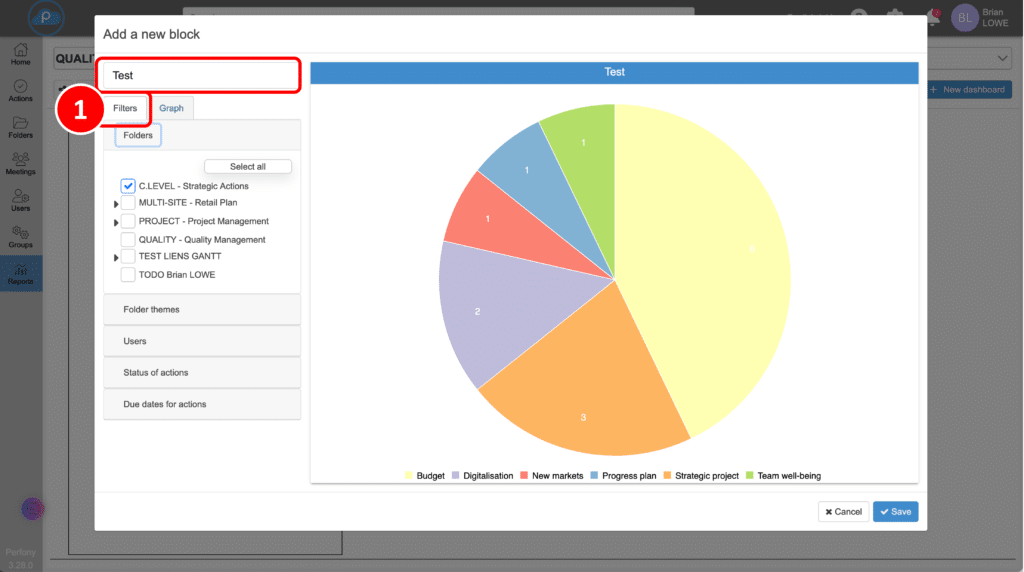
Stage 3: Naming and identifying source data
In the first “filter” tab, select the folders (source data)
You can then filter by :
- Folder themes
- Action responsible
- The status of actions
- The date of completion of the actions
Step 4: Choose the type of graph
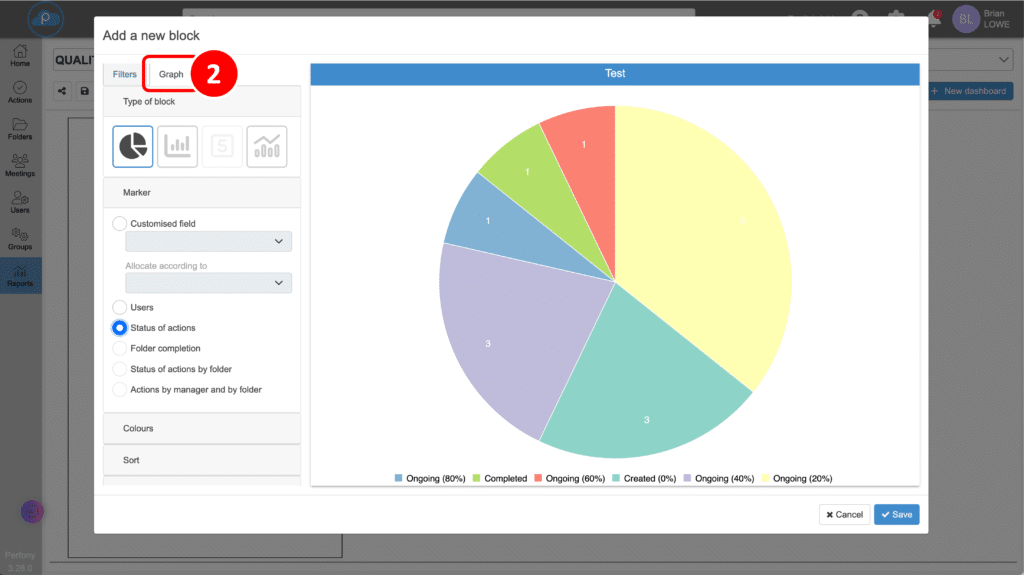
In the second tab, “Graph”, select the type of graph you want (see “Graphical dashboard” for details of the different types of graph).
You can then choose the actions allocation method according to :
- the values of a custom field
- those responsible for actions
- completeness of applications*.
- the status of actions by folder*.
- actions by person responsible by folder*
*These breakdowns are only possible with a bar chart graph.
You can then refine the graph with a wide choice of colours and sorting options.
Step 4: Save
For more details on the possibilities offered by the dashboard, please refer to the “graphical dashboard” and “dashboard tips and tricks” pages.