“Give visibility on their activity to all our users”
This is one of Perfony’s missions. For this purpose, many pages offer native graphics and visual indicators, such as the home page or the page that lists your folders.
It is also possible, in the “dashboard” menu, to create specific reports, as in theexample of budget management (reminder: these reports can be added to the home page!).
But what if you want a report to evaluate a particular case?
In what situations do I need to create a customized dashboard for a particular file?
Thanks to custom fields, Perfony offers to adapt your digital files to your field reality. The easiest way to understand this is to use examples.
- Example 1: You are in charge of quality, and you want to specify on which production line the maintenance actions must take place.
- Example 2 : you are responsible for the animation of a network of points of sale and you want to specify the site concerned
- Example 3: You are in charge of media planning and you want to distribute your actions to different media
- Example 4: You are a project manager and you need to cost each action.
In all these cases, and in all other possible cases, the creation of one (or more) custom fields allows you to adapt your action plan to your needs.
But how do you go back and create an indicator to specifically track this data?
How do I create a customized dashboard for my file?
Here are the steps to follow to create a dashboard directly in a folder (provided you are one of the drivers):
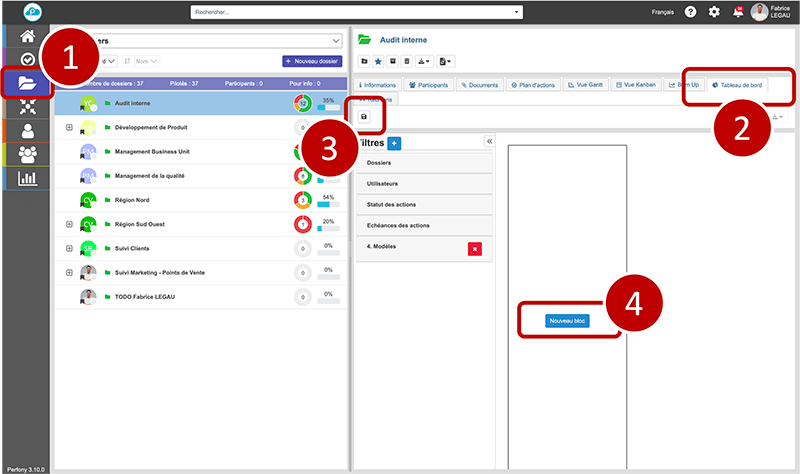
In the “folders” menu , go to the folder concerned, in the “dashboard” tab and click on the edit icon
Click on “new block” to open the dashboard editor

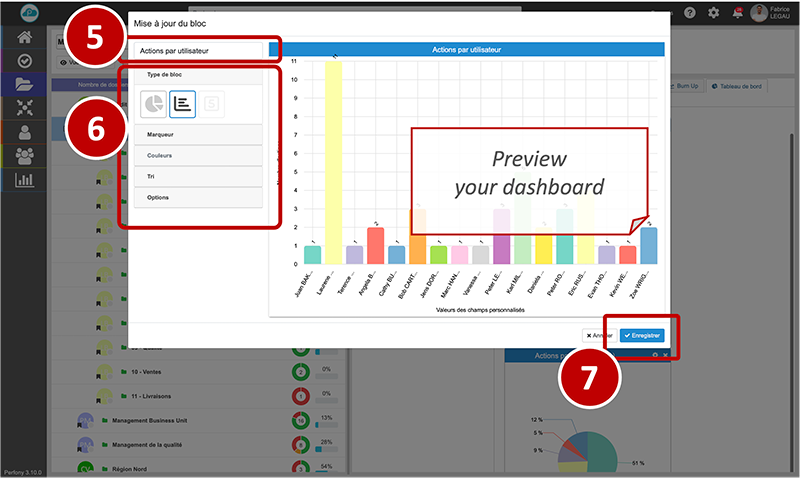
Give a title and set up your dashboard according to:
- The type of block desired: pie chart, histogram or numeric
- Markers to call up the data you want to display
- The colors of the graphs
- The order of sorting
Remember to register !

